Covid deaths are no longer rising in the Liverpool City Region, and infection rates are falling

Our latest update on the most important data
Good morning Post readers - the country is now in lockdown again. This newsletter is an update on the latest data for Covid deaths, hospitalisations and infections in the Liverpool City Region.
There are so many stories and numbers flying around at the moment, so we thought we would keep our update as simple as possible: summarising the three most important pieces of data we have, and where we stand on each.
As always, if you find this newsletter useful, please forward it to your friends or colleagues, or use the share button below to share it in group chats or on social media.
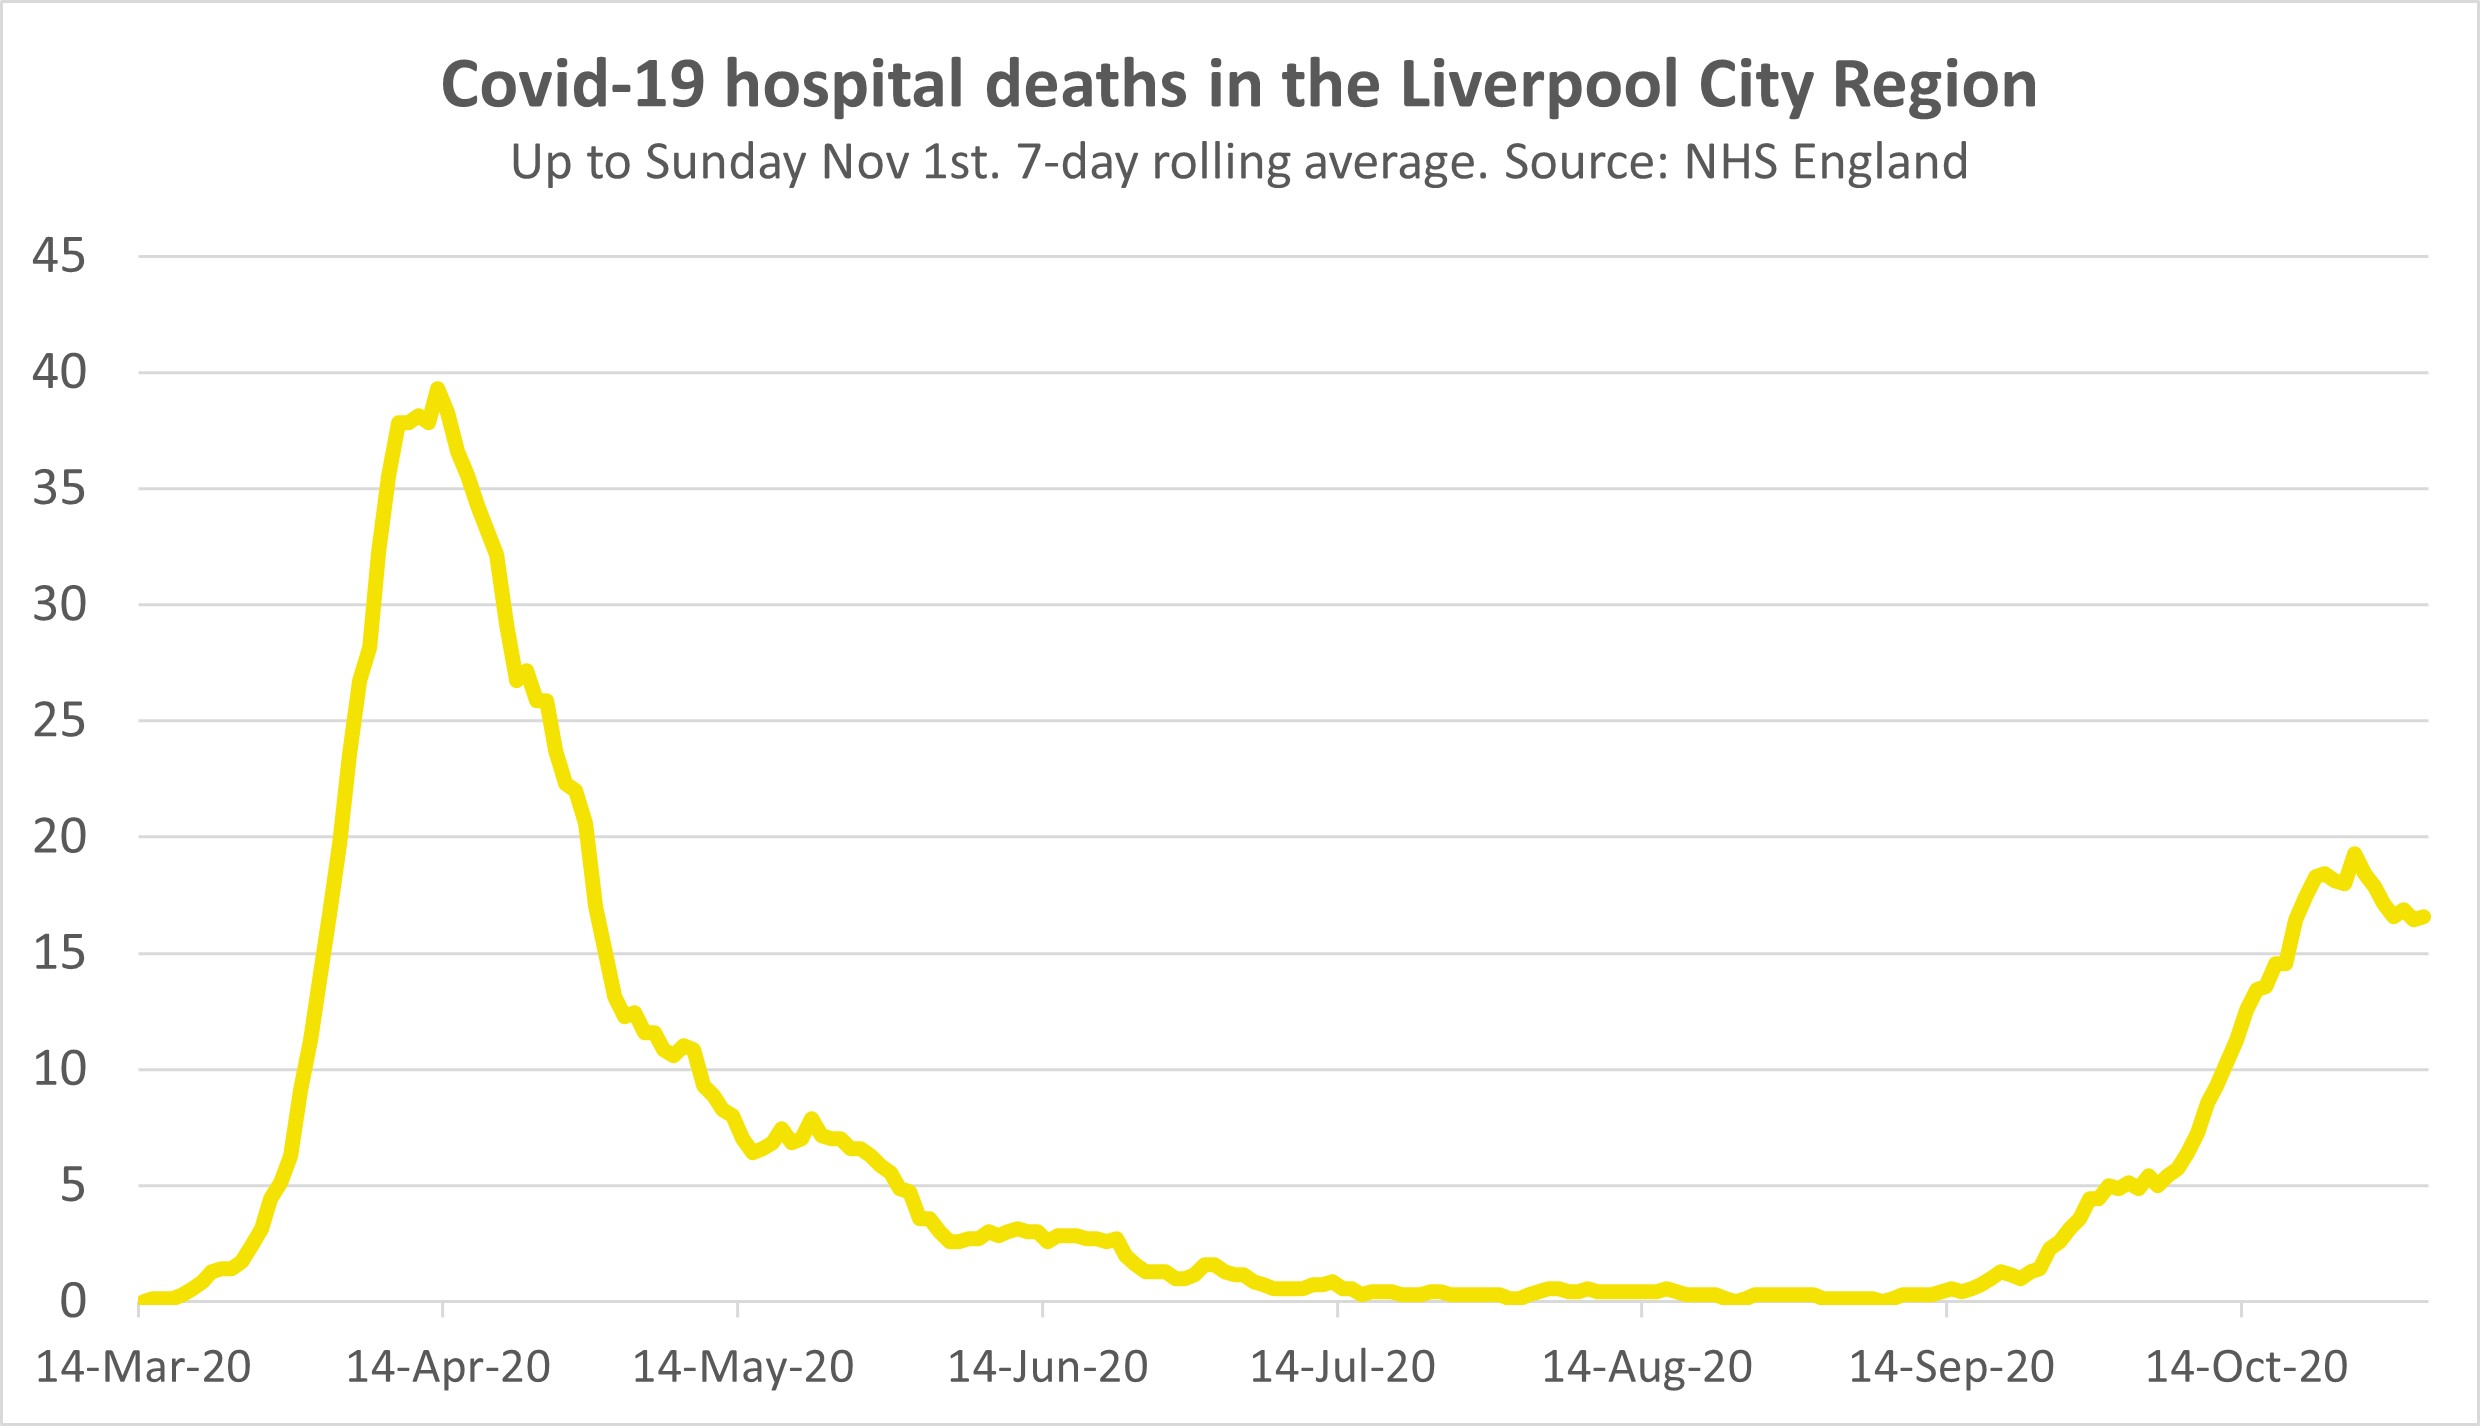
1. For more than a month, Covid hospital deaths were steadily rising. In the past week, they have levelled off at about 16 deaths per day.
Last week we said 16 Covid patients were dying each day in the city region’s hospitals on a seven-day average. That number has not risen - it is more or less flat on the week. It’s the first time since mid-September we can say that. The average daily deaths actually moved a little higher and then fell again, so you could say deaths are falling rather than flat, but perhaps be cautious with that because on Sunday the data shows 22 deaths, the third-highest day in the second wave. So we need to see where this line goes in the next week before we can be confident the tables have turned.
The latest figures are for the week ending Sunday (November 1st), and these are patients who have tested positive for Covid rather than necessarily dying because of it, but this is how the data is processed. The graph below shows deaths across the city region since March, showing that deaths have stabilised at about just over a third of the April peak level.

In Liverpool specifically, we can confidently say deaths are falling. The blue line in the chart below is daily deaths at Liverpool University NHS Trust, which still has the highest deaths of any trust in the country but has clearly stopped growing. Just to be clear, the chart below shows deaths per week rather than per day.
Latest covid deaths in hospital - it's looking like a definite flattening at Liverpool Uni Hospitals, thankfully.
— Lawrence Dunhill (@LawrenceDunhill) 9:30 AM ∙ Nov 2, 2020
And looking back a couple of weeks, we now know from the ONS that there have been “excess deaths” in the North West. That means we know that in this recent upswing in deaths in the city region, Greater Manchester and Lancashire etc, more people were dying than usually die at this time of year. There were 388 more deaths in the week ending October 23rd than the five-year average for the region - see the graph below. In that period there were 325 deaths which mentioned “novel coronavirus (COVID-19)” on the death certificate.
Deaths in the North West have risen to almost 30% above the 5-year average, says the @ONS. The region had 388 "excess deaths" in the week ending 23 October. A fortnight before, the data was showing no excess deaths. (Blue is total deaths, Red is Covid deaths, Grey is the average)
— The Post (@liverpoolpost) 1:53 PM ∙ Nov 3, 2020
2. There are still a lot of Covid patients in our hospitals, following massive rises in September and October. But that growth looks like it is slowing.
There are now 766 Covid patients in Liverpool City Region hospitals, a number which has grown more than 10x since mid-September, or 4x since a month ago. Clearly, if that kind of growth had continued, it would overwhelm hospitals before long. There are 56 Covid patients on mechanical ventilators. Both numbers - the total number of beds occupied by Covid patients and the number of mechanical ventilation beds occupied - are growing more slowly than they were in the weeks before, the first rising by 7%, the latter rising by 10%. The numbers were released by Steve Rotherham, below:
Latest hospitalisation figures across the Liverpool City Region 👇
— Steve Rotheram (@MetroMayorSteve) 2:42 PM ∙ Nov 3, 2020
The BBC got access to the Royal Liverpool earlier this week and produced a very moving report, which brought home the human stories behind the figures for hospitalisations and deaths. It’s worth reading the online version for those tales. Below is a passage that is more data-focused, and gives an insight into why the hospital is under pressure.
Liverpool University Hospitals Trust, which includes Royal Liverpool and three other hospitals, has 463 Covid in-patients, 73 more than the peak of 390 in early April. A key difference between the spring and now is the additional medical demands. Back then, there was little demand for intensive care from non-Covid patients. Many people with urgent conditions stayed away. Half the trust's beds were empty. Now they are about 95% full. Like other hospitals, there are plans to expand capacity to look after critically ill patients. But that depends on having enough staff. Sickness levels are about three times normal levels. Having dealt with the first wave, and then spent the summer trying to catch up with surgery that was postponed, the medical teams are looking at months of sustained pressure.

3. Infection rates are still high but have fallen in every part of the city region, particularly in Knowsley, Liverpool and Sefton.
Quite recently, the Liverpool City Region had some of the worst local authorities in the country in terms of Covid infections rates. Now, none of our districts appear in the top 25 local authorities with the highest rates in England.
- Knowsley is 29th, and its rate has fallen more than 30% in a week. Last week it was 3rd.
- St Helens is 31st, and its rate has fallen almost 14% in a week.
- Liverpool’s rate has dropped 30% and it is now the local authority with the 50th highest rate in the country. A week ago it was the 8th highest.
- Sefton now has the 70th highest rate in the country, and it has dropped by around 28%.
- Halton is 80th, with a rate down 17% on the week before.
- Wirral is 94th on the list, down almost 20%.
To see the actual rates (which are new tests per 100,000 residents), click over to this list here.
Thanks for reading The Post. If you found this briefing useful, please forward it to a friend or use the share button below.
If you have ideas about stories The Post should cover in future, or people who are doing interesting things in the city region who we should interview, please get in touch by replying to this email.
And if you know a journalist or writer based in Merseyside who might like to contribute to The Post, please send them our way. We are looking for regular contributors so we can start to expand our operations in the new year.

Comments
Latest
Merseyside Police descend on Knowsley
And the winner is...
Losing local radio — and my mum
A place in the sun: How do a bankrupt charity boss and his councillor partner afford a “luxury” flat abroad?
Covid deaths are no longer rising in the Liverpool City Region, and infection rates are falling
Our latest update on the most important data