Infection rates are falling in the Liverpool City Region, but deaths continue to rise
Rates are now falling in Knowsley, Liverpool, Sefton and Halton
Good afternoon and welcome to the third newsletter from The Post. This is an update on the latest Covid-19 data in the Liverpool City Region, covering infection rates, hospital admissions and deaths.
Before we get to that, if you missed our post on Saturday it was a great read about the discovery of stolen bodies at the docks and anti-doctor riots that took hold of Liverpool during the cholera outbreak almost 200 years ago.
And a quick request: Many thanks to our early readers who have shared The Post on Facebook and told friends about us already. If you think a friend or colleague would find this newsletter useful, please do forward it on and tell them why you follow The Post. You can also use the share button below.
Infection rates are starting to fall again
Infection rates in the Liverpool City Region are still very high, but the growth we were seeing at the start of the month is over and rates are now falling in Knowsley, Liverpool, Sefton and Halton. The spread is quite large - Knowsley has a rate twice as high as Wirral, for example - but all the local authorities are in the top 60 areas in England for infections.
Just quickly on the data: The infection rate is new cases per 100,000 residents over a week. All these numbers are for the week ending last Wednesday. And remember that infection rates are very contingent on how much testing is being done, so they are at best a broad indicator of the spread and incidence of the virus.
- Knowsley’s rate is almost 620, the highest infection rate in the city region and the third-highest of any local authority in England, but it is down 13% on the week before.
- Liverpool’s rate is just under 550 and is down 15% on the week before. It’s the 8th highest local authority in England.
- St Helens has a rate of 470, up 6% on the week before.
- Sefton’s rate is just under 450 and is down 0.6% on the week before.
- Halton’s rate is a little over 340 and is down 1% on the week before.
- Wirral’s rate is just over 300 and is up 2% on the week before.
This great Twitter account updates the numbers every day based on the data from Public Health England.
Hospital admissions are very high
It’s much harder to get up-to-date numbers for the situation in hospitals because there is a bigger delay in publishing the figures, but this is what we’ve got.
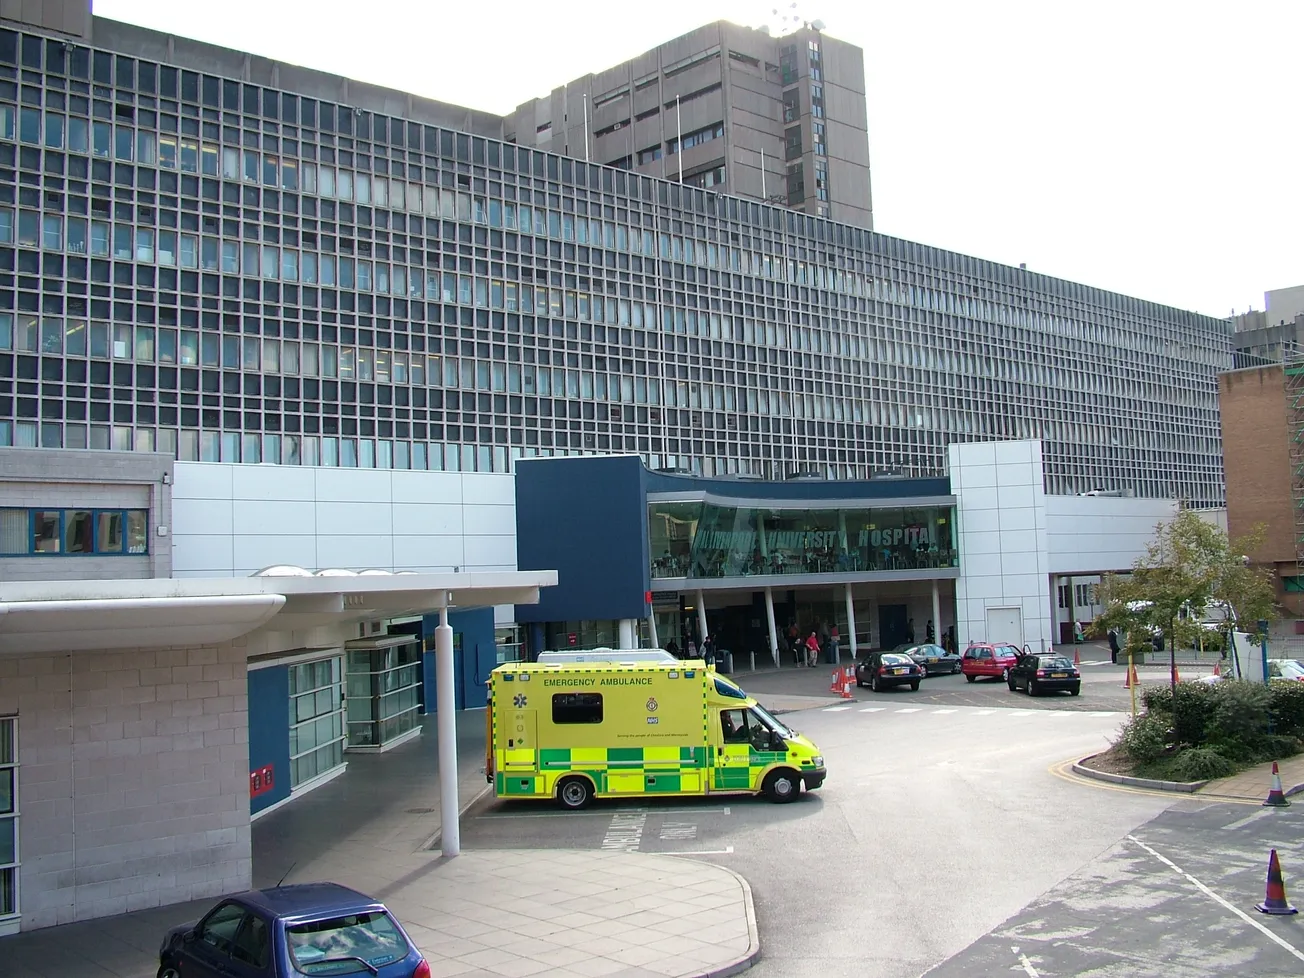
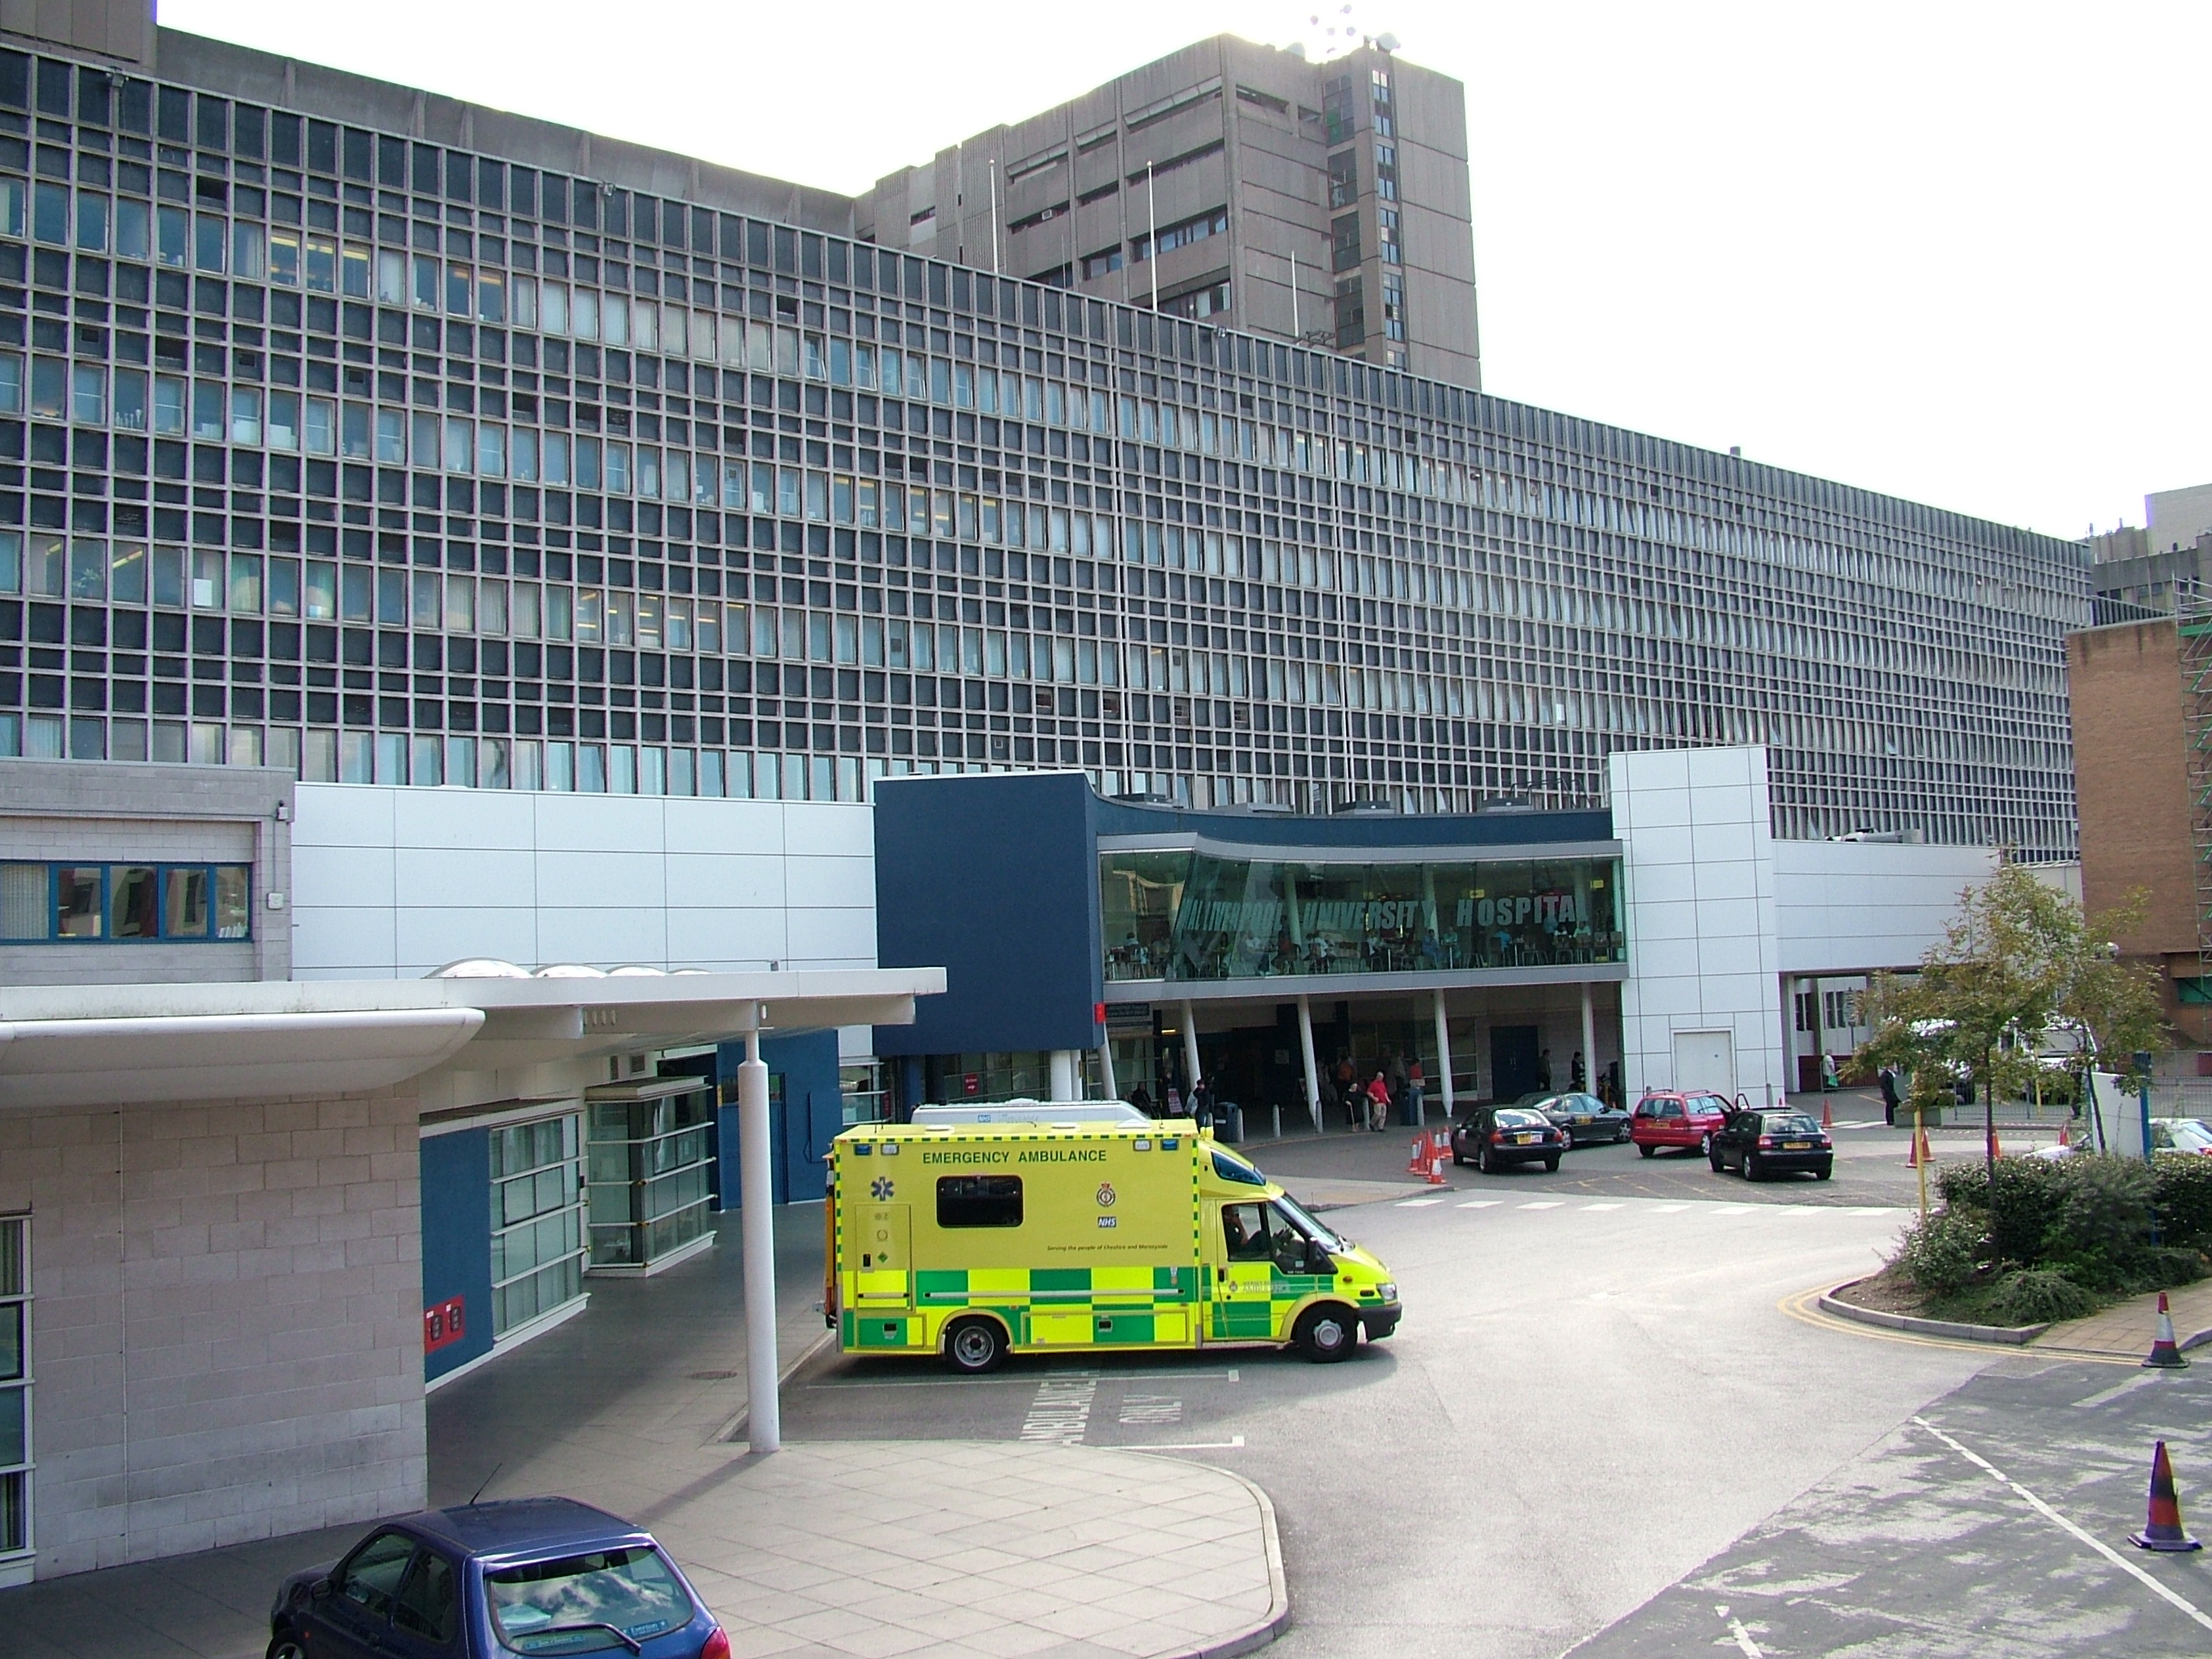
According to Professor Stephen Powis, the National Medical Director of NHS England, there are an awful lot of Covid patients in Liverpool’s hospitals (the city that is). He said at Boris Johnson’s press conference a week ago: "I expect that Liverpool University Hospitals will have more patients by tomorrow with Covid in their hospitals than they had at the peak in April." That doesn’t necessarily mean the hospitals can’t cope with the present level of admissions (surge capacity, other hospitals in the region and the North West’s Nightingale hospital in Manchester can all help), but clearly it is concerning.
Liverpool’s city mayor Joe Anderson tweeted yesterday that there are 446 Covid patients in the city’s hospitals, whereas last Thursday he said “almost 400” and two weeks ago he said “more than 250”, so that gives a sense of the rate of growth. He also said that 87% of ICU beds were currently being used, which hasn’t changed in the past week. According to NHS data, Liverpool University NHS Trust had a critical bed occupancy of 86.4%. That’s not a perfectly comparable figure, because we don’t know how much ICU capacity has been increased this year, or how many elective surgeries have been postponed, but the proportion of beds available is currently similar to last year.
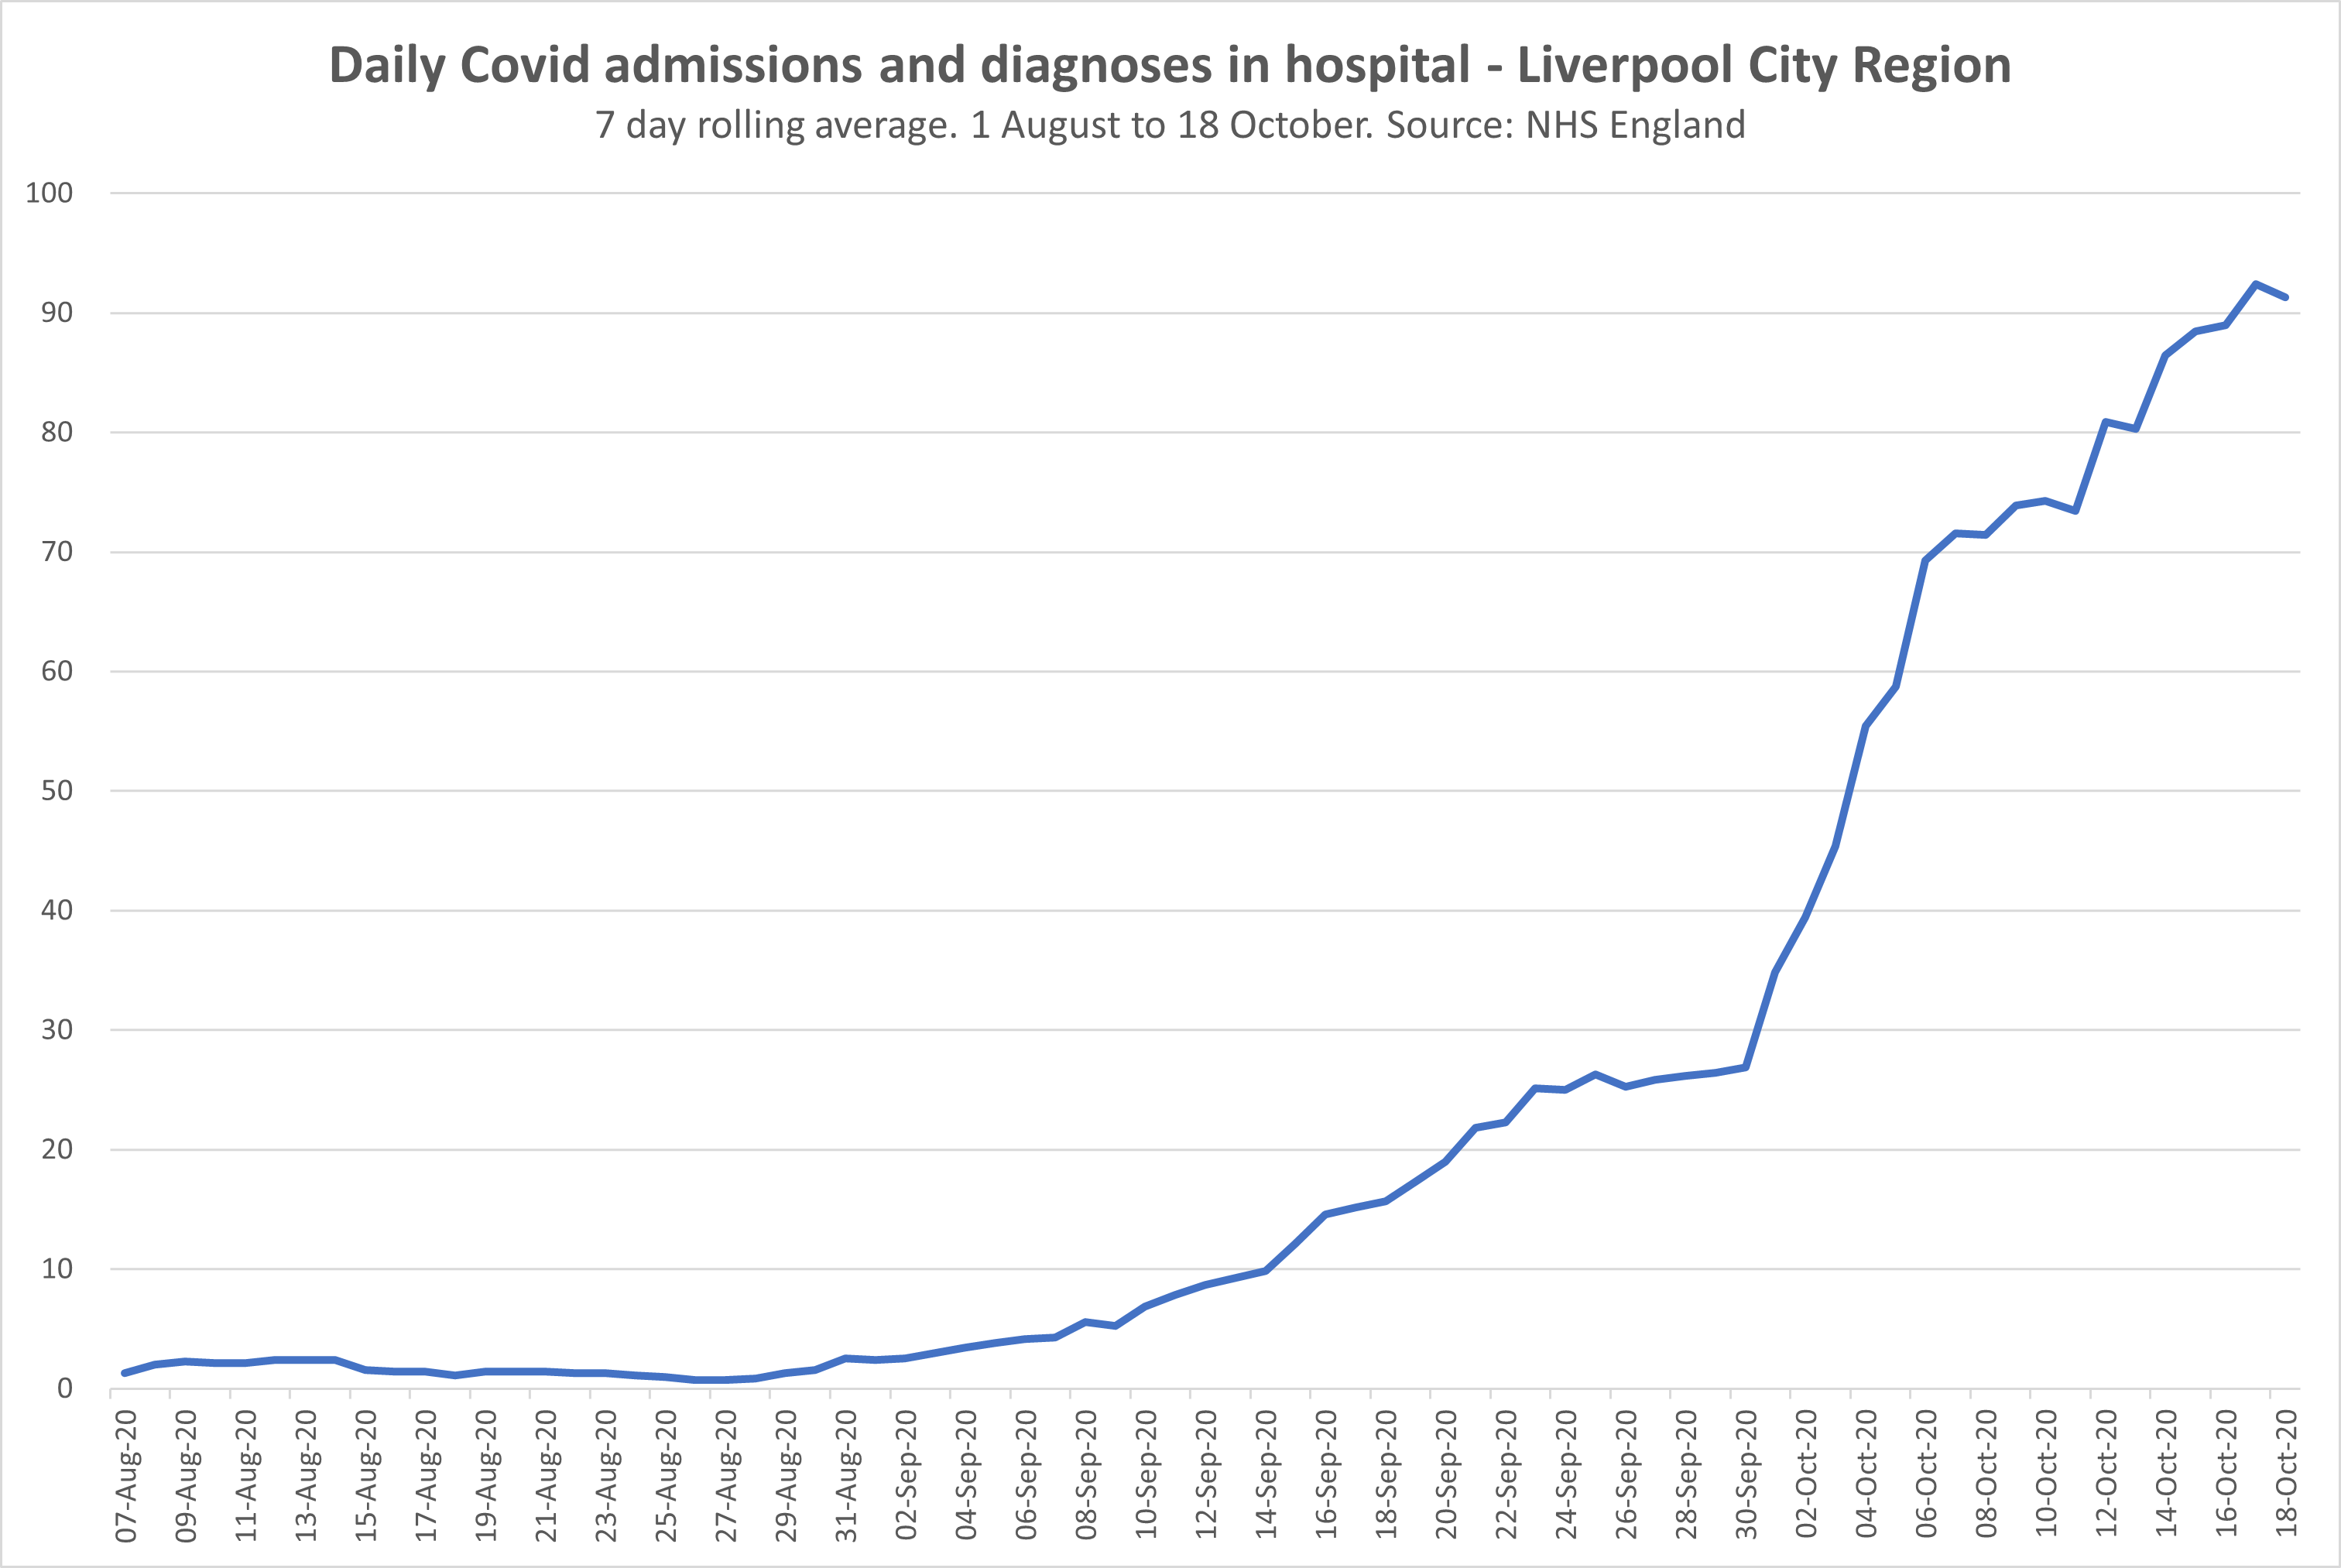
What about the city region as a whole? Figures for total bed occupancy only go up to October 1st, so they aren’t very useful. The admissions figures are a bit more up to date, going up to nine days ago, and they show about 90 people per day being admitted to the city region’s hospitals with Covid-19 or being diagnosed with the disease within the hospitals, more than four times higher than a month before. The graph below shows admissions and diagnoses across the city region from August 1st to October 18th.
Deaths are almost half the peak level
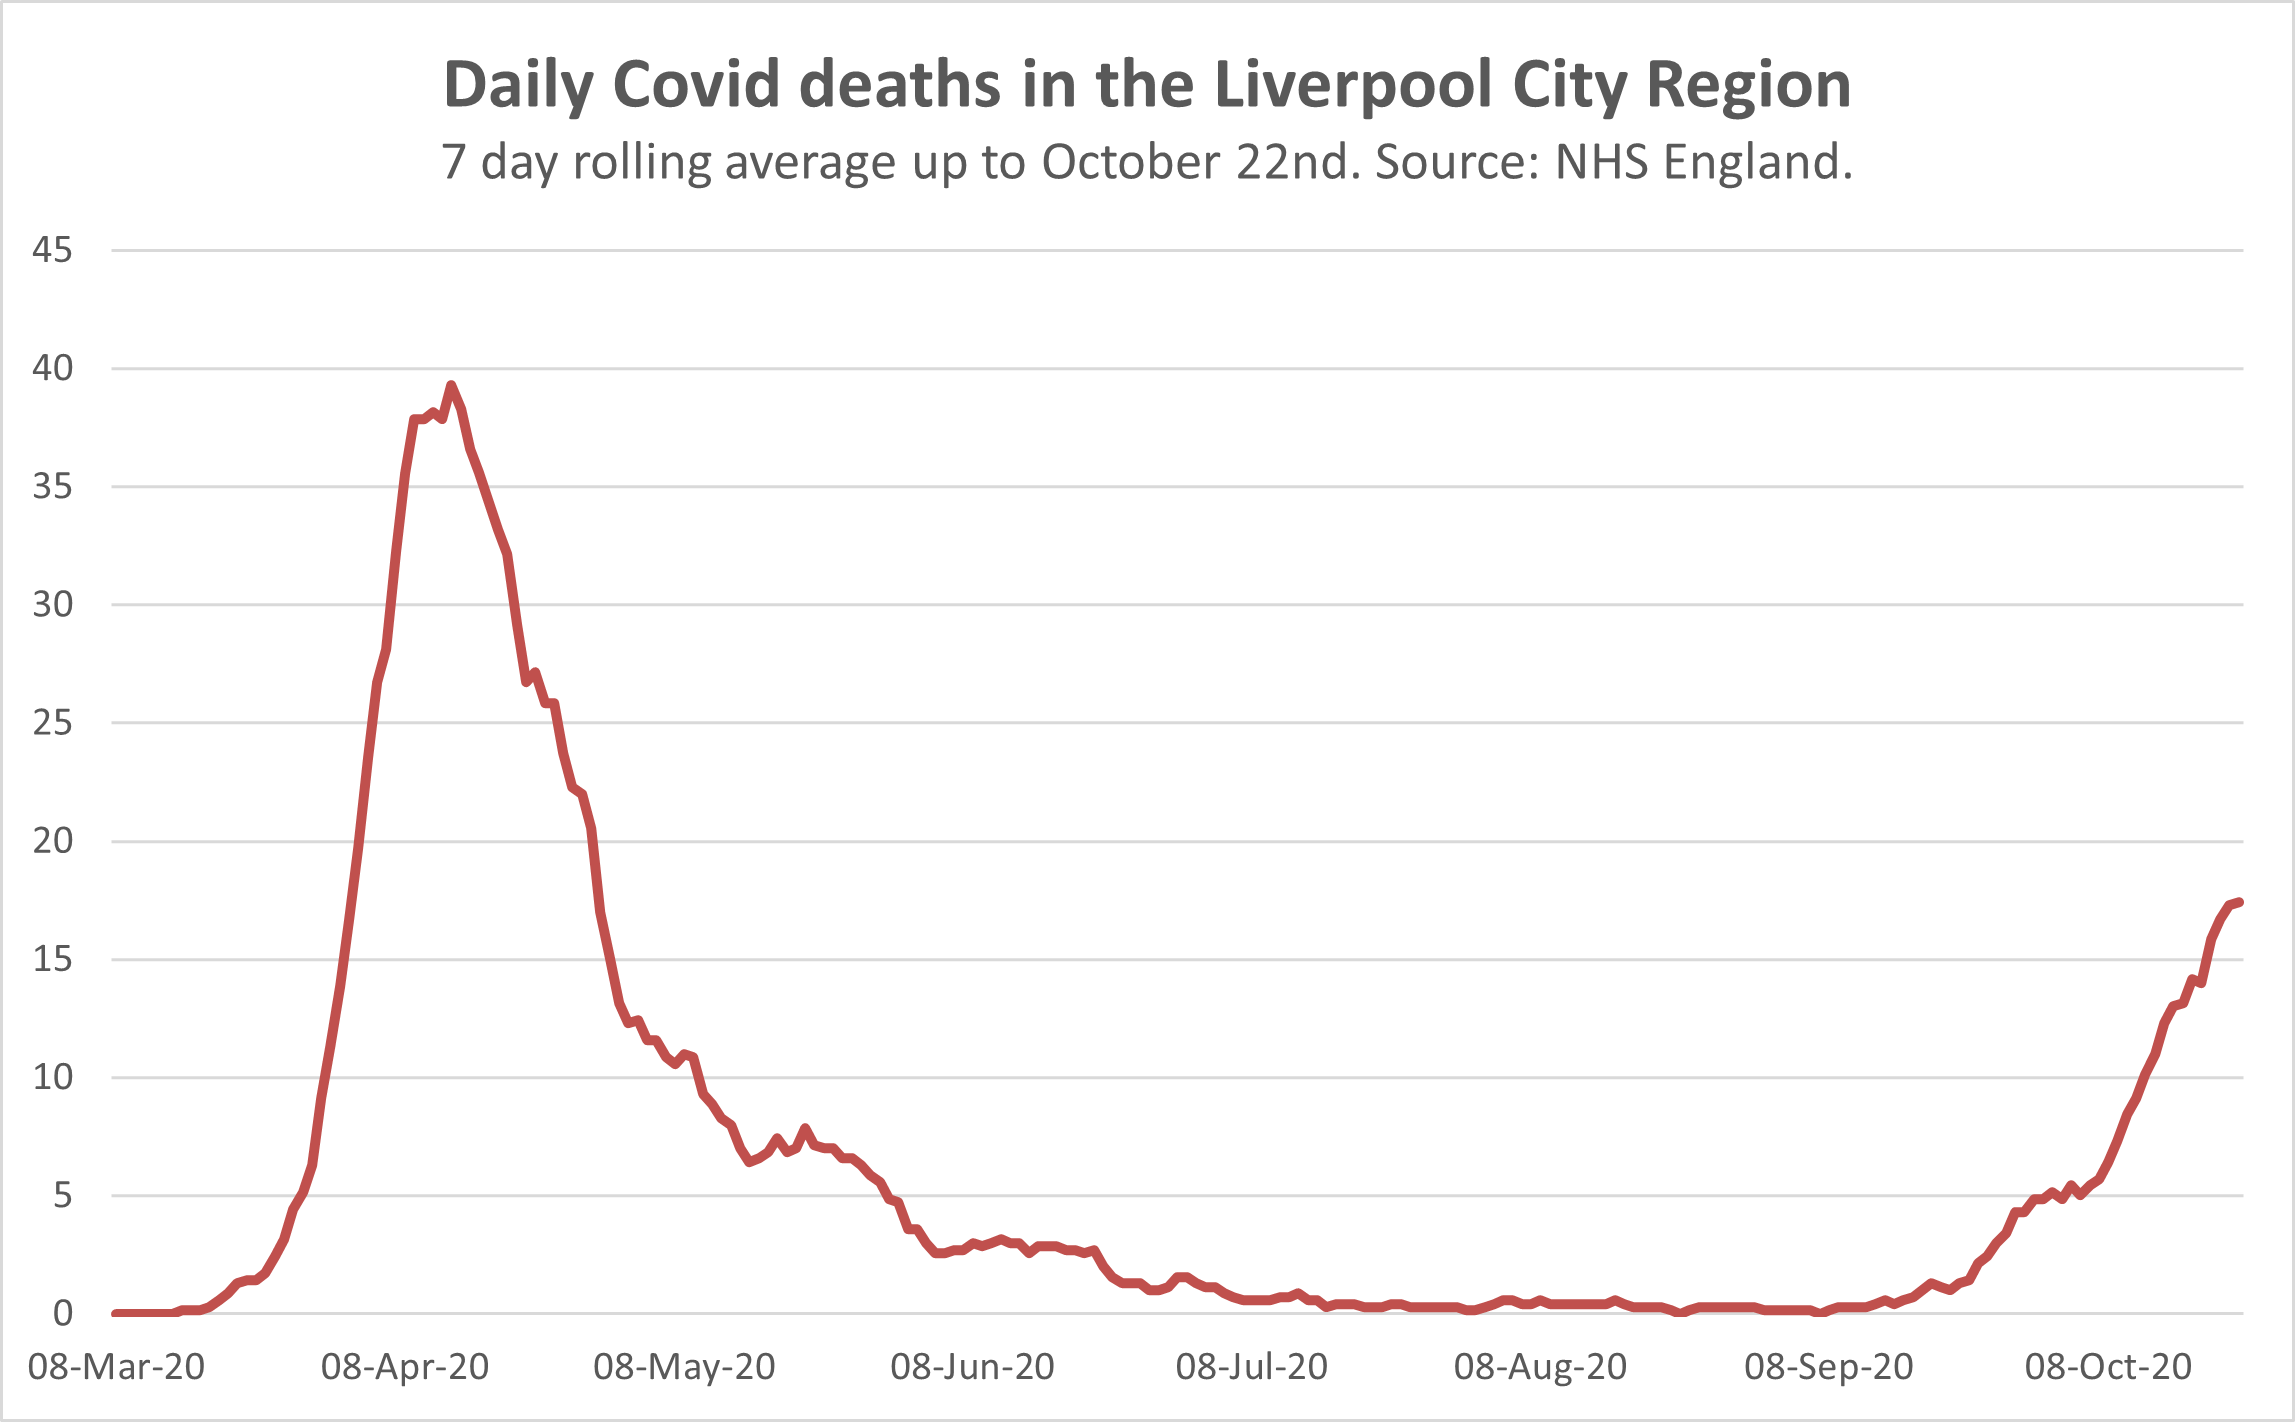
There are now just over 16 Covid patients dying each day in the city region’s hospitals, up from 10 per day a week before. The figures are for the week ending last Thursday, and these are patients who have tested positive for Covid rather than necessarily dying because of it, but this is how the data is processed. Deaths are now approaching half the level we saw at the peak in April, as you can see on the graph below. Clearly, the numbers are growing, but less rapidly than they did in the Spring.
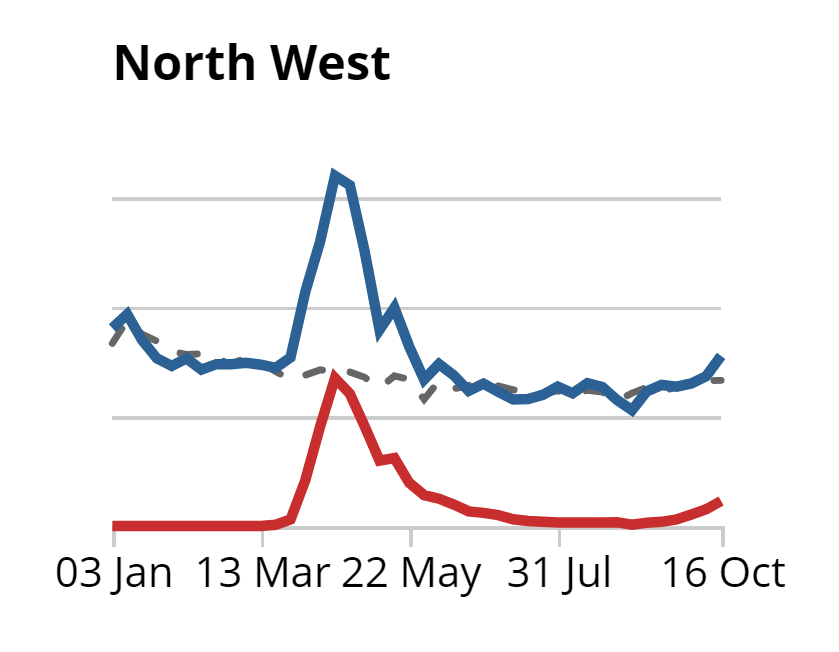
Today the ONS released new numbers which show deaths in the North West are now above the five-year average, meaning we are seeing “excess deaths” again in this part of the country, and to a lesser extent nationally. In the week ending October 16th, there were 17% more deaths than the average (224 more). The graph below shows deaths this year (blue), the 5-year average (grey) and Covid deaths (red).
If you have any questions or ideas for future newsletters, please just hit reply to this email. And you can comment on this post using the button below.

Comments
Latest
How Liverpool invented Christmas
This email contains the perfect Christmas gift
Merseyside Police descend on Knowsley
Losing local radio — and my mum
Infection rates are falling in the Liverpool City Region, but deaths continue to rise
Rates are now falling in Knowsley, Liverpool, Sefton and Halton