How bad is the Covid-19 spike in the Liverpool City Region?
The latest numbers and a fact check on whether more testing is to blame
Good afternoon Post readers — this is a brief update on the local Covid-19 numbers, because for the first time in a couple of months, they are rising fast again. The numbers cover the whole Liverpool City Region and go up to the end of December.
If you find this briefing clear and useful, please do hit reply and tell us so we can decide how often to send it during the lockdown and this (hopefully) final phase of the pandemic. If you think someone you know might find it useful, please forward them this email or use the button below.
Case rates have shot up
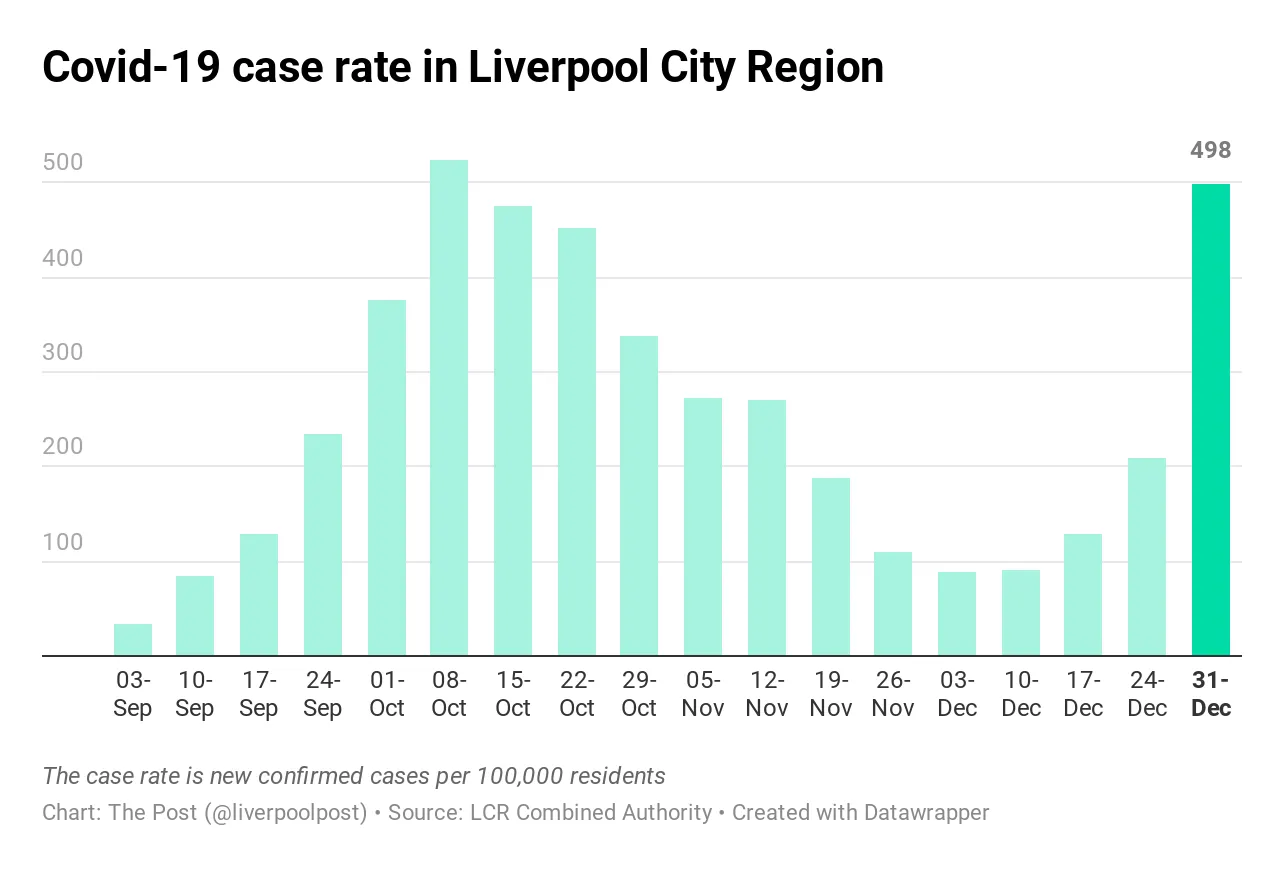
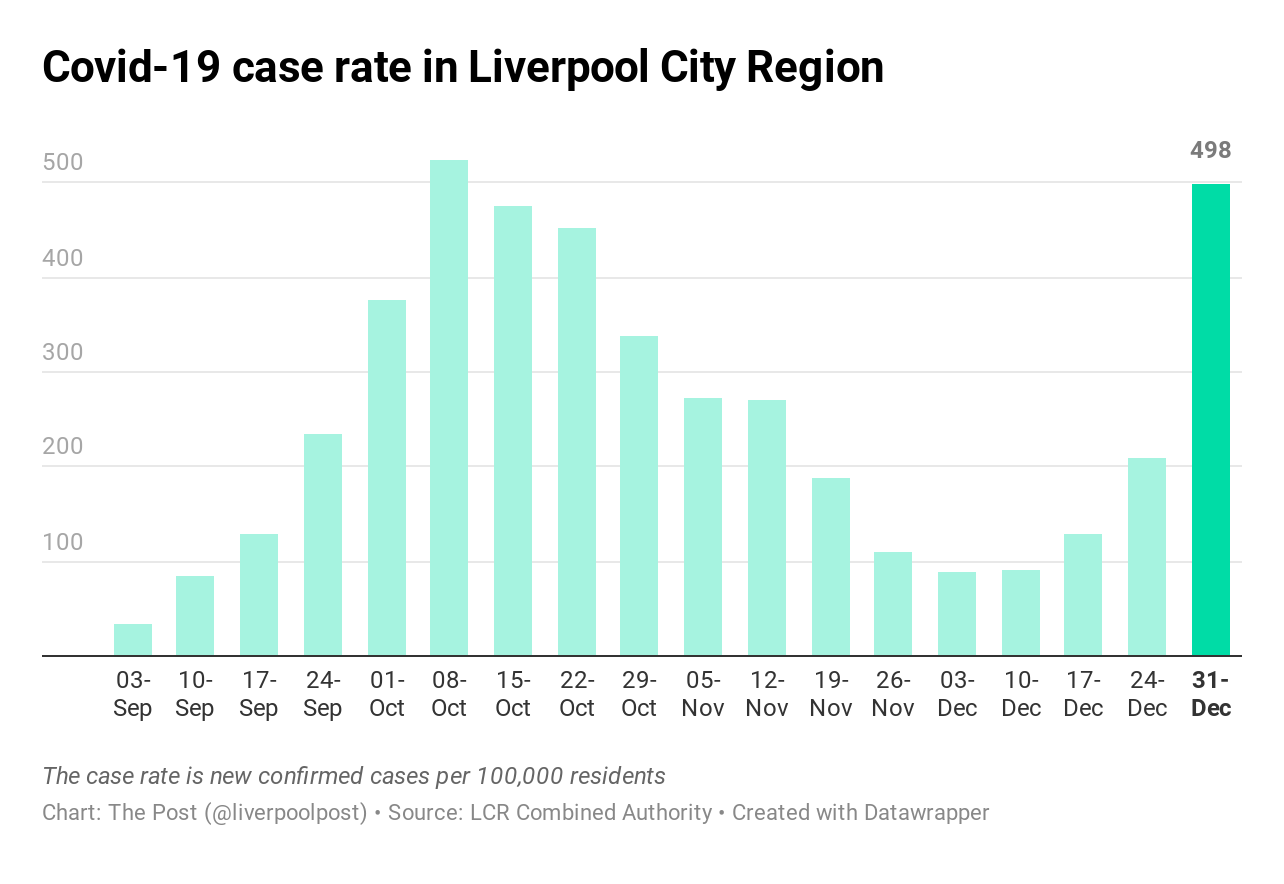
“Given the rapid rise in infections, an effective national lockdown is the right thing to do.” That’s the view of Steve Rotheram, the city-region mayor. He’s referring to the trend you can see in the graph below, which shows case rates (new cases confirmed in a week per 100,000 residents) soaring in the week ending December 31st.
The rate of 498 is just below the average for England. And it’s about the same rate we saw in the first week of October, when the city-region was having its big second wave. But as you can see below, this time it’s risen much faster compared to the week before. That’s the concern, especially because extra mixing people did over Christmas won’t be reflected in these new positives yet.
Not a Liverpool city wave
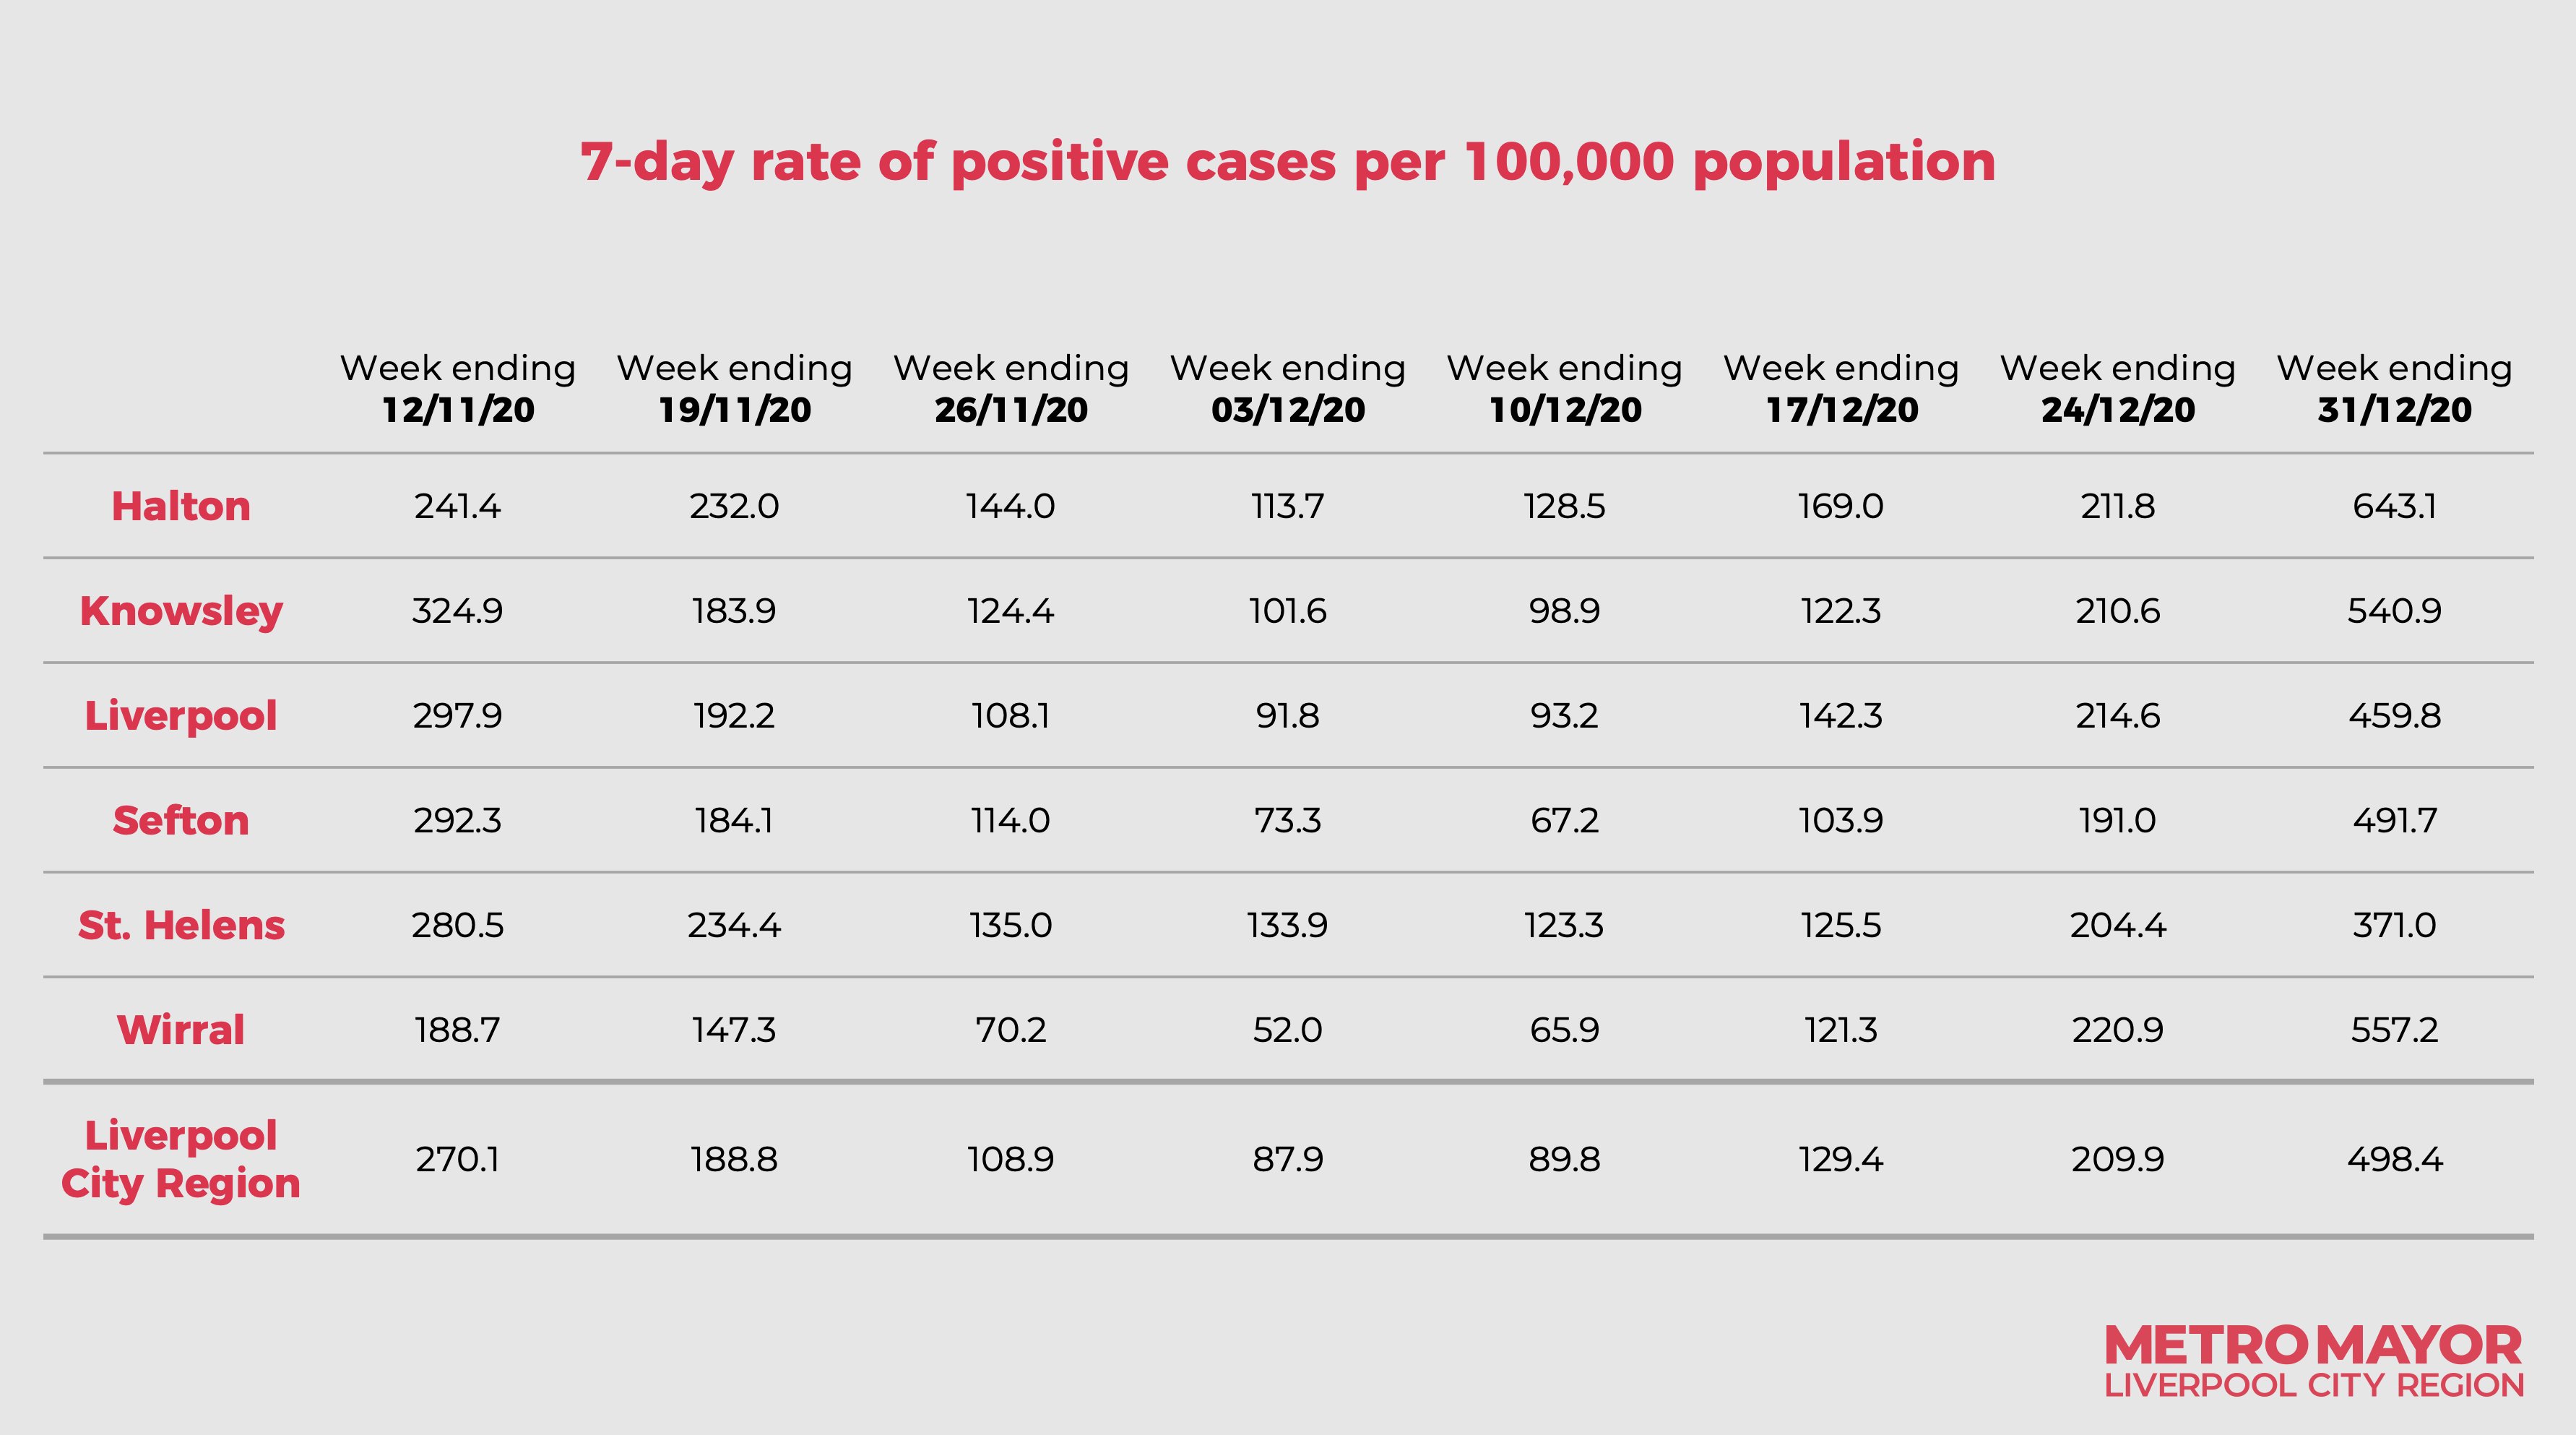
The highest case rates are in Halton, Wirral and Knowsley, but really the new positives are pretty well spread across the city-region, with St. Helens faring the best. This is by no means a wave being driven by infections in Liverpool city itself.
The graphic below, which was released by Rotheram, shows the rates for each local authority going back to early November.
Hospitalisations rising again
There are currently 404 Covid-19 patients in the city-region’s hospitals, and 28 in mechanical ventilation beds, which roughly equates to intensive care beds. That compares to almost 800 patients and 56 on ventilators during October’s peak.
The patients number has increased gradually over the past month, but certainly isn’t spiking yet. If case rates stay high, we will unfortunately expect to see these hospital numbers track up in the weeks ahead. We’ve made the graphic below so you can see how these two numbers have moved around since September.
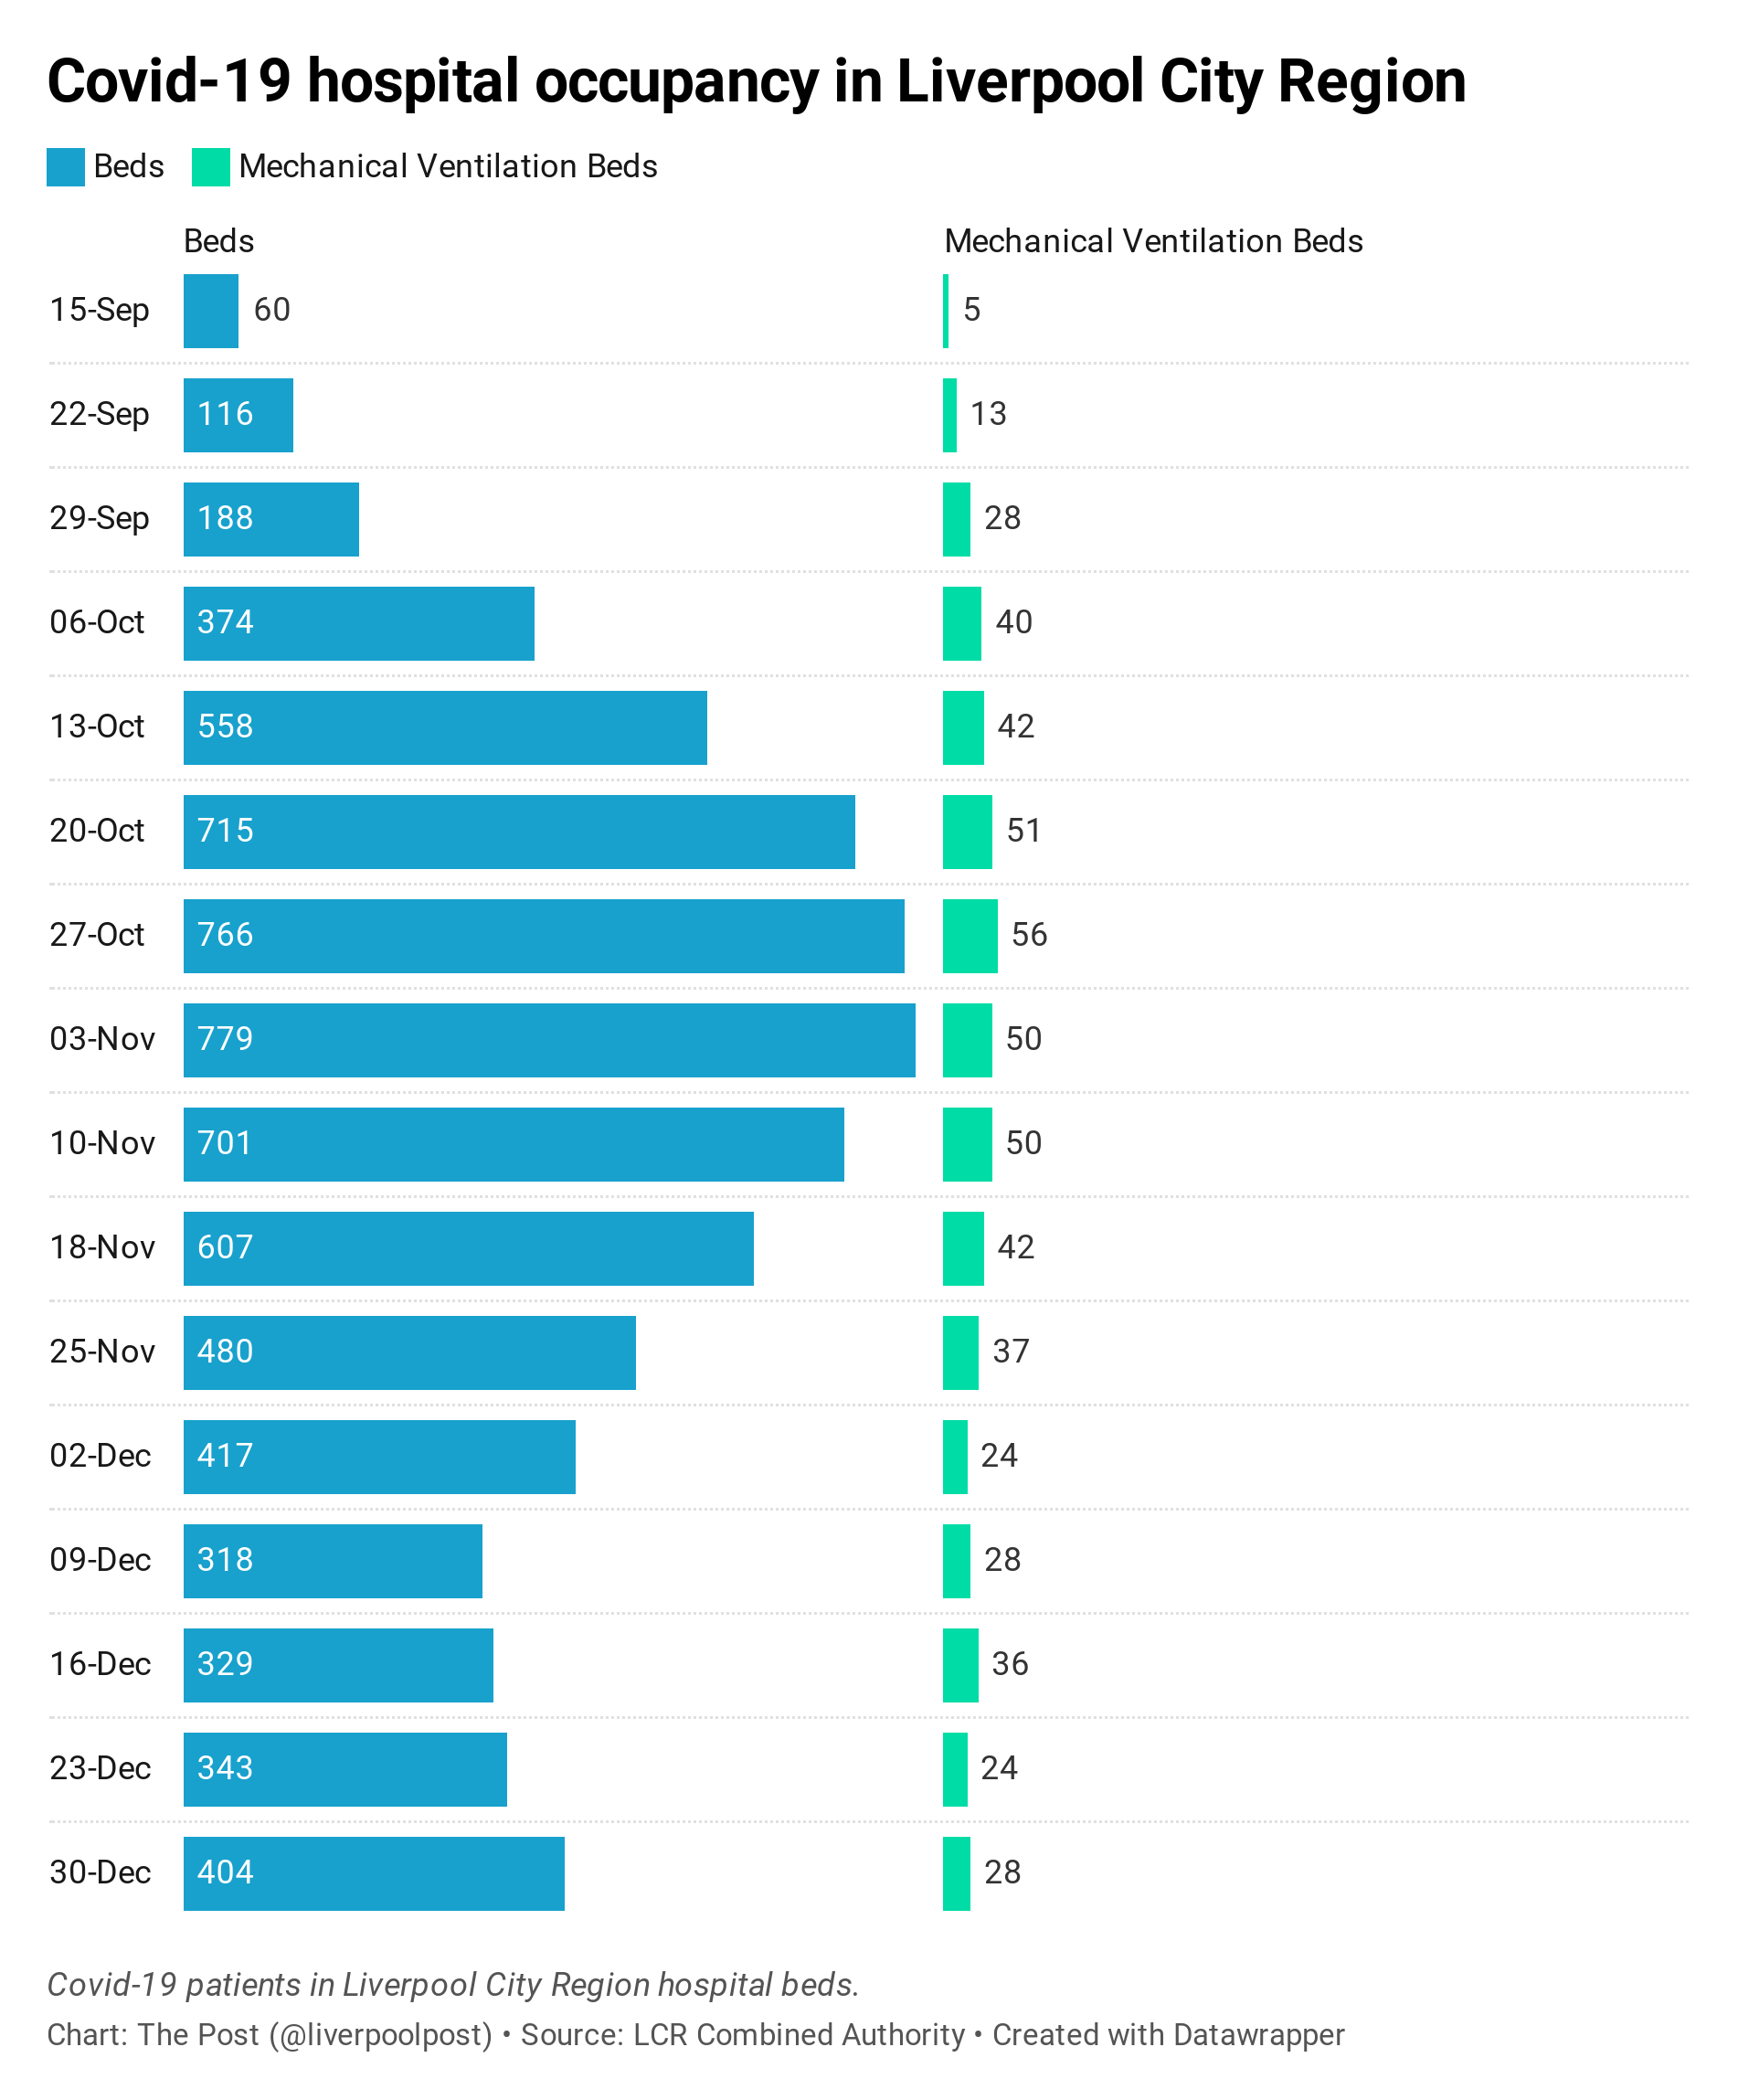
What’s notable here is that hospitals have not had time to recover properly from the last wave (the October one), and are therefore now filling up from a higher base than they were in the autumn. You can see that clearly from the size of the blue bars in September versus the ones in December. Add in the fact that January is often the busiest year for hospitals, and you can understand the concern about pressure on our local NHS.
Fact check: is more testing to blame?
Some people have wondered on social media whether the big spike in case rates revealed this week is in fact being driven by increased testing rather than a real increase in the prevalence of the virus in the community.
That’s a legitimate question. Of course, the more testing you do, the more cases you are likely to find, which is why you always need to treat the case rate as a broad indicator rather than a precise measure of prevalence. People who have seen long queues for tests over the Christmas break wonder whether that is what explains the spike in positives.
Government figures do show a lot of people taking the rapid lateral flow tests in Liverpool in the week before Christmas, with a spike on December 22nd. That might indeed account for some of the case rate increase. However, there’s strong evidence that the prevalence of the virus is actually growing rapidly.
The positivity rate (the percentage of people who took a test and got a positive result) was around 5% a fortnight ago in the city of Liverpool and has just risen to more than 15% on a 7-day average. That’s for the old-style PCR tests, but you wouldn’t see that kind of increase in positivity if the virus wasn’t spreading. Positivity peaked in October at 20%. Look at the blue line in the graph below, which is for Liverpool itself.
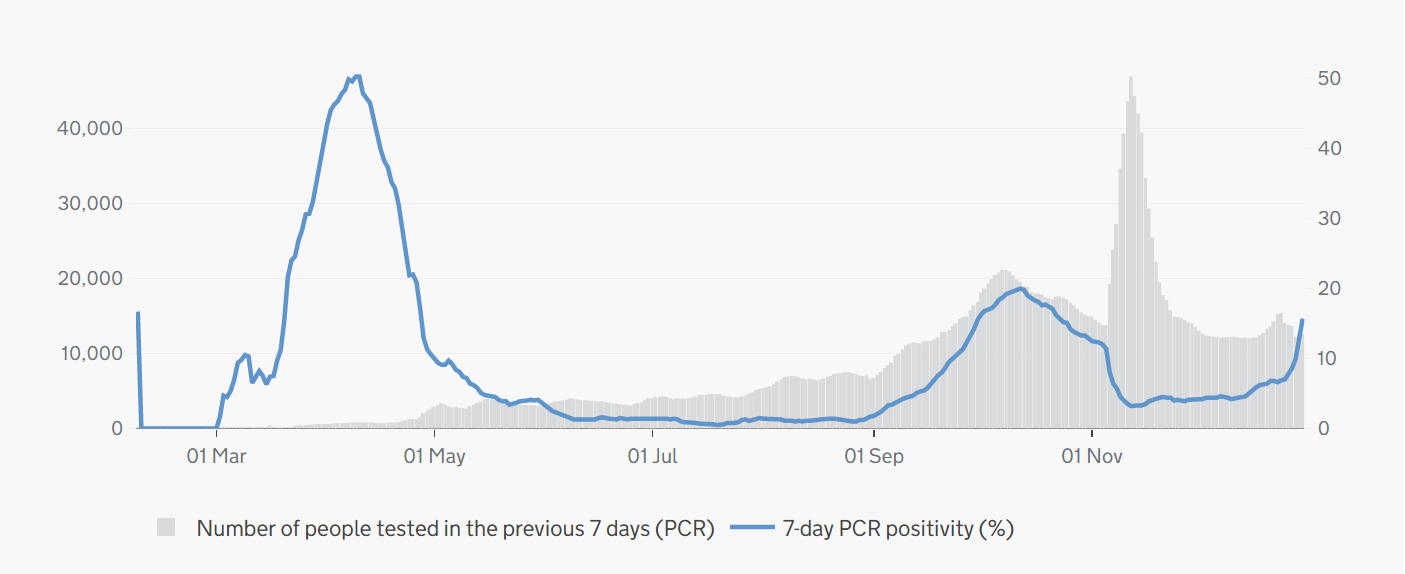
You see very similar trends in the positivity rates in the other boroughs of the city-region too — you can look for yourself here. So on balance, we have to conclude that rates aren’t just rising because of increased testing and that there is strong evidence that we are seeing a sudden increase in the amount of the virus in our communities.
Found this newsletter useful? Please forward it to friends or use the button below. And if you have seen something on social media that you want us to fact-check, just reply to this email.
The Post is still very early in its life and we are only publishing the occasional newsletter, just to cover some stories we think are important and see what people like reading. Later this year we will become a fully-fledged operation, once we have the resources to do that and there is sufficient demand.
We have a few great pieces coming up in the next couple of months, and will do more Covid-19 briefings too. Talented journalists in the region who would like to write for us should email editor@livpost.co.uk.
If you missed our last story — “The Georgian townhouse at the centre of Liverpool's political scandal…” — you can read it here.
I totally love @liverpoolpost already. Providing the best insights and features on our great city.
— James Corbett (@james_corbett) 10:37 AM ∙ Nov 27, 2020
The families on Merseyside who dread the approach of Christmas
Fascinating story into the background to Joe Anderson’s arrest: The Georgian townhouse at the centre of Liverpool's political scandal by @liverpoolpost
— Simon Jones (@ariadneassoc) 10:55 AM ∙ Dec 19, 2020
The Brutus sailed from Liverpool on the 18th of May, carrying 330 passengers to Quebec. Three and a half weeks later it was back at port, and 82 of them were dead.
— The Post (@liverpoolpost) 3:01 PM ∙ Nov 5, 2020
A story about riots, conspiracy theories, and Liverpool in the time of cholera.

Comments
Latest
A huge moment for us
The fall (and rise) of Catholic Liverpool
Developers gave the council millions to improve Liverpool. Why haven't they spent it?
Berlin, Rome, Bruges and...Liverpool. The city brings in its tourist tax
How bad is the Covid-19 spike in the Liverpool City Region?
The latest numbers and a fact check on whether more testing is to blame